The score belongs to the pairing, not the model
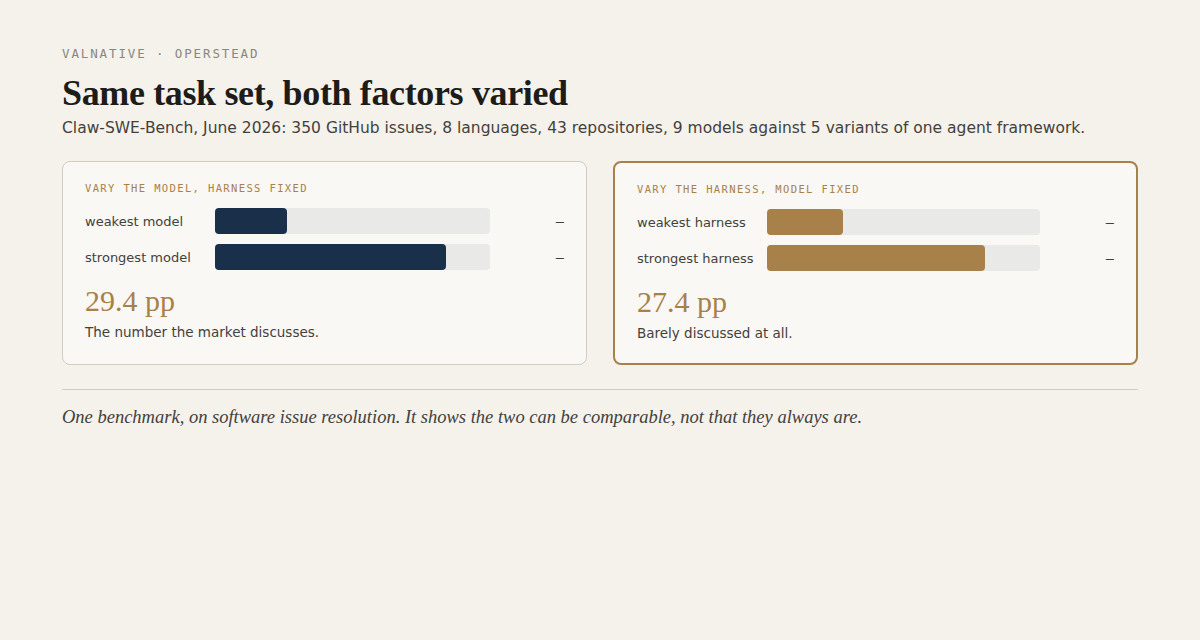
The two numbers that sit side by side The cleanest result comes from Claw-SWE-Bench, published in June: 350 real GitHub issue-resolution tasks across eight programming languages and 43 repositories, with nine models swept against five variants of the same agent framework.
The two numbers that sit side by side
The cleanest result comes from Claw-SWE-Bench, published in June: 350 real GitHub issue-resolution tasks across eight programming languages and 43 repositories, with nine models swept against five variants of the same agent framework.
Vary the model while holding the framework fixed, and Pass@1 moves by 29.4 percentage points. Vary the framework while holding the model fixed, and it moves by 27.4.
Those are the same order of magnitude. One is the number the market discusses and the other is barely discussed at all. Note the scope before carrying it anywhere: this is one benchmark, on software issue resolution, and it is the only study in the window that varied both factors on the same task set. It establishes that the two can be comparable, not that they always are.
The widest single observation in the sweep is more dramatic. On one backbone, GLM 5.1, the same benchmark scores 19.1% under a minimal direct-diff adapter and 73.4% under a full one. That is 54.3 points of difference with the model held completely constant.
Read that figure carefully, because it is easy to overstate. The minimal adapter is a deliberately poor harness, not a bare model with no tools. So 54.3 points measures the engineerable distance between a bad build and a good one. It is not the model-alone-to-agent delta, and anyone quoting it as such is quoting it wrong.
Harness-Bench, from May, gives the same shape at lower amplitude with a cleaner design: a full factorial of eight model backends against six agent frameworks, 5,194 trajectories over 106 tasks. Averaged across all eight models, completion runs from 81.6% under the best framework to 60.0% under the worst. A 21.6 point spread attributable to the software around the model.
Three things these numbers do not show
The harness term is not a constant, and the best one depends on the model.
HealthAgentBench, from June, ran the same models through different agent frameworks in a clinical informatics setting. GPT-5.5 scored 42% under one and 35% under another. Opus-4.8 scored 36% and 32%, and the ordering of the frameworks reversed between them: the setup that helped one model hurt the other.
That is the only observation in the sweep where the sign flips, and it matters more than its size. It means you cannot treat the harness as a fixed bonus added to whatever model you pick. The pairing is the unit.
Almost nobody publishes dispersion.
Terminal-Bench v2.1 averages three repeats per task and publishes one number per model, with no spread and no confidence intervals. The Artificial Analysis coding index does the same across three constituent benchmarks. τ³-bench publishes headline numbers per domain and no variance at all.
Of the seven qualifying benchmarks, the ones that publish uncertainty do it partially: confidence intervals on pooled rates, or cross-condition spread rather than repeated-run variance. The quantity a buyer actually needs, how much the same configuration varies from run to run on the same task, is largely absent from the public record.
Everything here was measured where verification is free.
This is the caveat that should travel with every number above. A coding harness can be good precisely because it can run the tests, read the failure and try again at no cost and no risk. The same is true of terminal work and, to a lesser extent, of clinical informatics with a machine-checkable answer.
Most work is not like that. Bedside care, food service, inspection and the trades offer neither a free verifier nor a costless second attempt, and in several of them a retry is unsafe. The honest expectation is that the harness term is smaller where verification is expensive, because much of what a good harness does is exploit cheap retries. Carrying 54 points, or even 21, into a domain without a verifier would overstate what engineering can deliver there.
How large is the harness effect really
A July decomposition study measured something related but not the same. Comparing a full production system against its own base model, it finds gains of 11.0 points on one benchmark of 400 items, 7 to 10 on another, and roughly 15 on a third.
Seven to fifteen, against Claw-SWE-Bench’s fifty four. Resist the urge to average them, because they are not measuring the same distance. The July study’s baseline is a model already inside a working system with basic tool access; the Claw-SWE-Bench floor is a deliberately crippled adapter. Different scorers, different task populations, different starting points.
The plausible explanation is that baseline difference, and it is a hypothesis rather than a demonstrated reconciliation. What can be said without it: both studies find the surrounding software worth a double-digit swing, and the size of that swing depends heavily on what you are comparing it against. Anyone quoting a single number for the value of a harness is quoting a number that came with a baseline attached.
One detail in that study deserves separate attention. Of its total gain, the isolated verification loop contributes only 1.5 points, with the rest attributed to scaffolding, routing and specialist models. In that same study the verifier caught roughly a fifth of the errors it saw, and fixed about three quarters of what it caught.
One study, one verifier, and no claim that the ratio generalises. But it is worth sitting with, because a checking layer that catches a fifth of what passes through it is functioning as a filter rather than as comprehensive cover, and the two get budgeted very differently.
What the benchmarks are actually about
There is a coverage problem underneath all of this, and it is worth stating plainly because it limits how far any of these numbers can be carried.
Five of the seven qualifying benchmarks measure software engineering or terminal work. One measures clinical informatics, meaning radiology, pathology and data auditing rather than care delivery. One measures customer service. The broadest occupational mapping in the window, GDPval-AA v2, covers 44 knowledge-work occupations, and within each of them only the tasks that produce a document or a deliverable.
Set that against a full task inventory and the correspondence is thin. Mapping these benchmarks onto the roughly 18,800 task statements of the US Department of Labor’s occupational catalogue, we estimate direct correspondence at something like 2 to 4%. That figure is our inference from counting occupations, not a number reported by any source, and it is specific to that catalogue. For bedside nursing, food preparation, manufacturing inspection and the skilled trades we found no qualifying benchmark in the window at all, meaning none that publishes enough method to be checked. Two robotics benchmarks exist with genuinely occupational task content, and both fail on exactly that.
So when a claim about how much work AI can do rests on benchmark performance, it rests on the part of work that benchmarks happen to measure, which is the part that runs in a terminal and checks itself.
What to ask instead
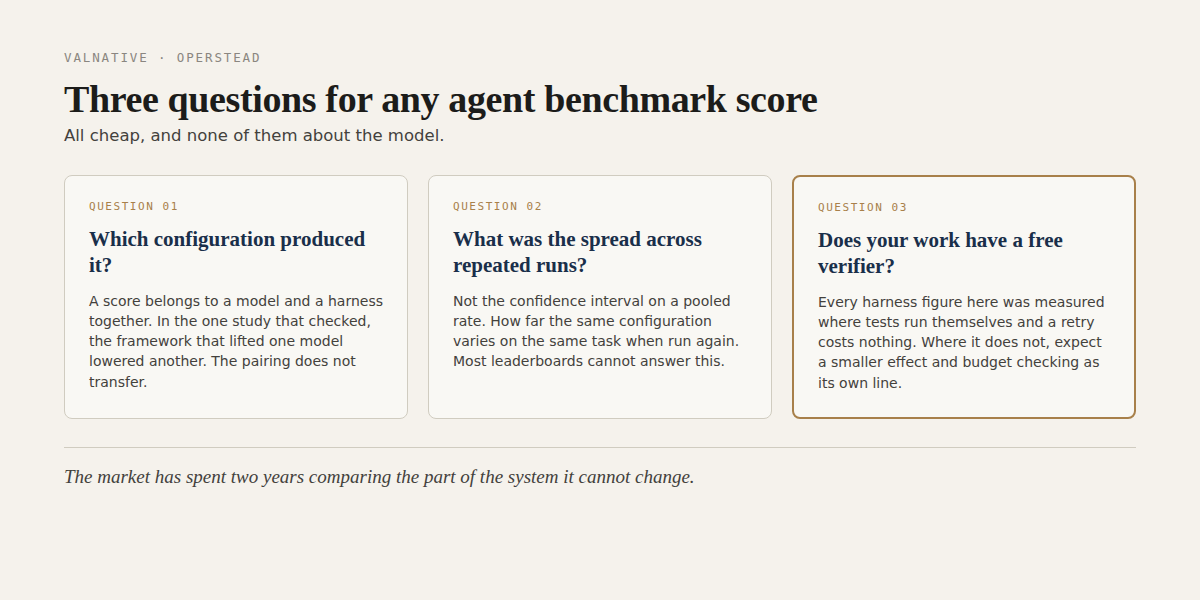
Three questions, all cheap.
Ask which configuration produced the number, not which model. A score belongs to a model and a harness together, and the pairing is not transferable: the framework that lifted one model lowered another in the only test that checked.
Ask what the spread was across repeated runs. Not the confidence interval on a pooled rate, but how much the same configuration varies on the same task when run again. Most published leaderboards cannot answer this, which is itself worth knowing before you plan around one of their numbers.
Ask whether your work has a free verifier. If it does, the harness engineering in these results is likely to transfer, and it is worth paying for. If it does not, expect a smaller effect and budget verification as a first-class cost rather than as something the framework absorbs.
This is why we build Operstead as an execution harness rather than a model wrapper. It is designed for the layer these benchmarks are measuring without naming: what the system may call, how failures are handled, what happens on a retry, when it stops, and what gets recorded. The market has spent two years comparing the part of the system it cannot change. The part you build barely appears in the comparison at all.